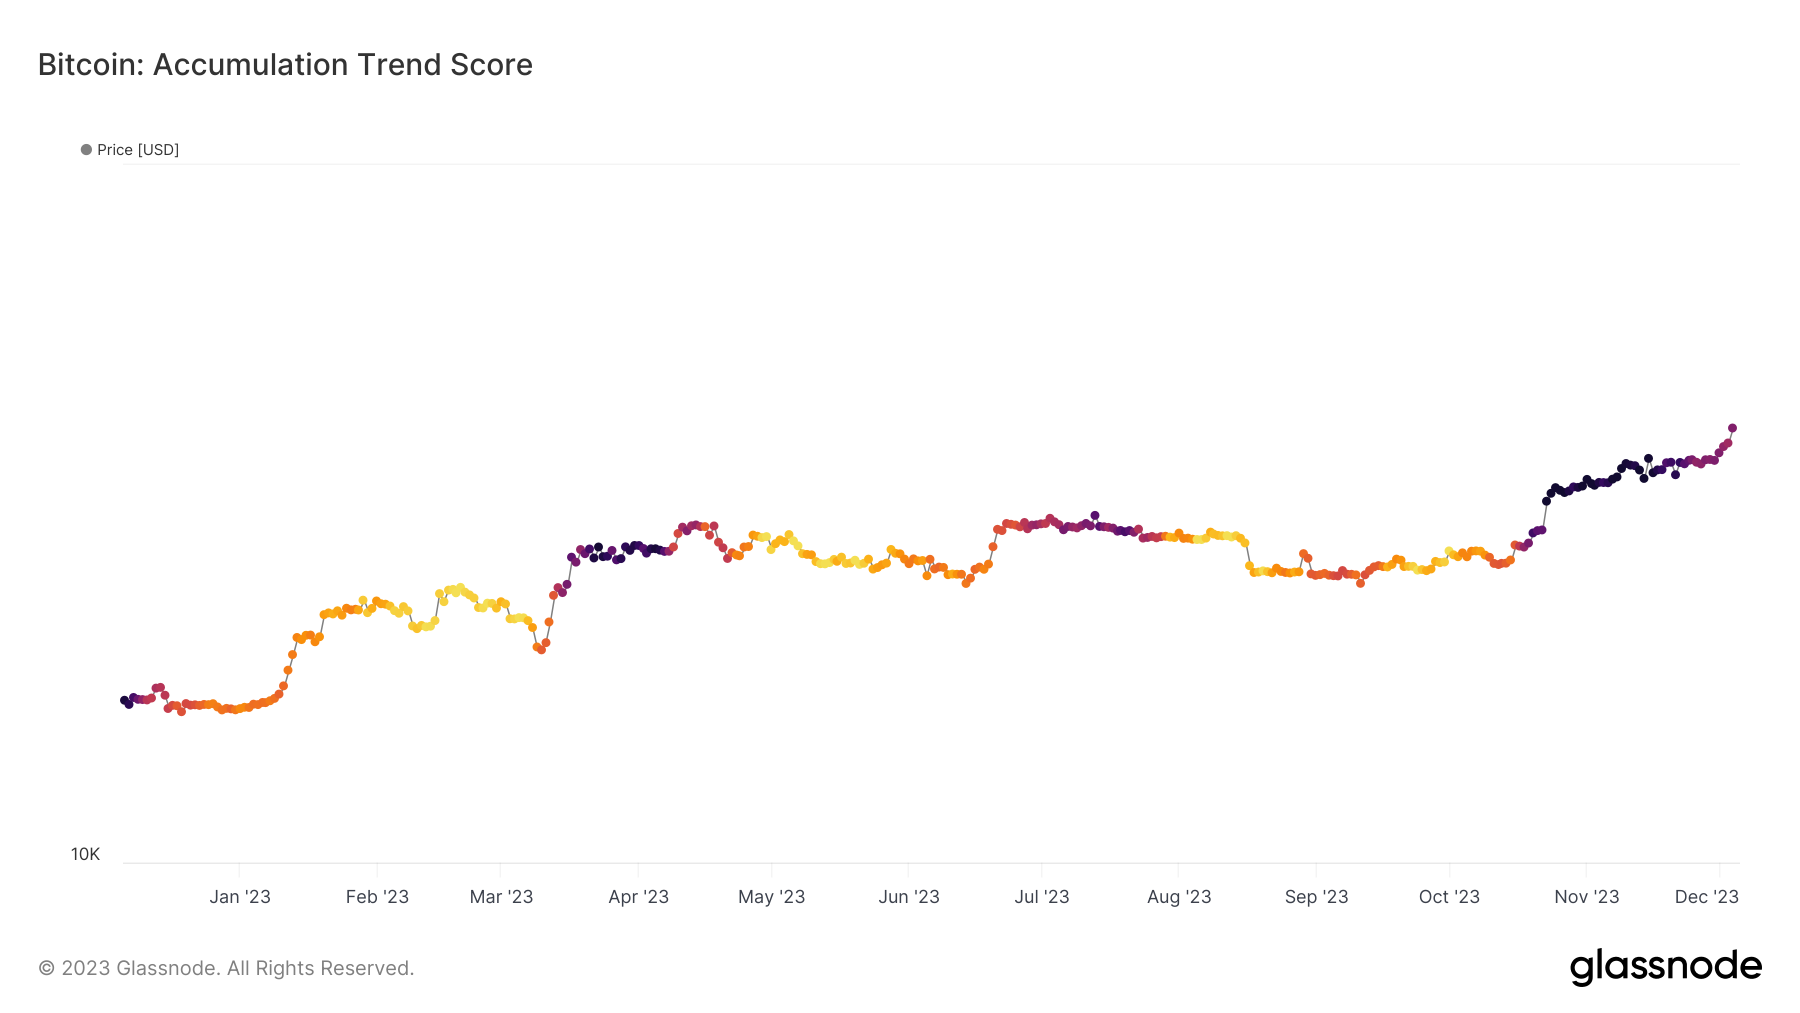
Bitcoin’s upsurge has seen the leading cryptocurrency increase 65% since Oct. 6th, accompanied by a distinctive accumulation pattern bitcoin whales.
The Accumulation Trend Score, a metric that assesses the relative strength of coin accumulation based on entity balance size, has revealed some intriguing patterns. The accumulation trend score was 1 from mid-October to mid-November, suggesting high accumulation across all cohorts. This phase, typified by a ‘deep blue accumulation,’ indicates robust market participation.
Notably, following this accumulation period, a behavioural shift in whale entities which own 10,000 BTC took place. Despite the ongoing price surge, which reached $45,000, these whales started distributing coins, moving away from prior accumulation trends.
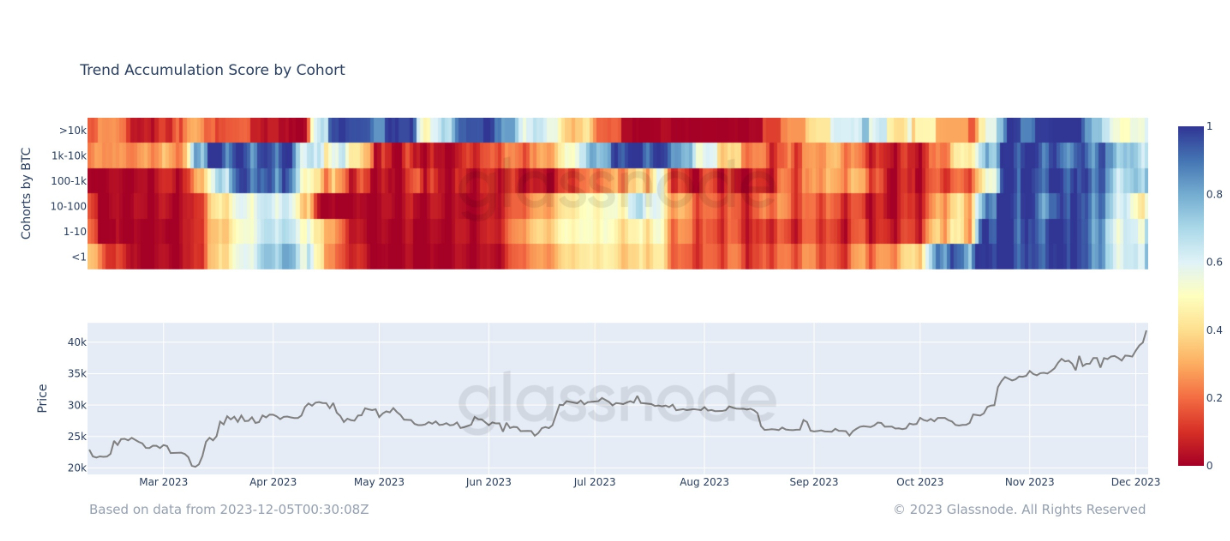
While the tail end of whale spectrum carries significant weight, other cohorts appear to be absorbing such selling pressure at these higher prices. This implies ongoing confidence in Bitcoin as price surges higher. Aggressive accumulation is still observable across cohorts, with smaller whales appearing to gain ground, as noted by on-chain analyst James Van Straten on X.
You like trends.
20% of the supply of BTC is held by people who have 10BTC or less; look at the acceleration and trend.Whales, 1k BTC or more, held 90% of the supply now hold 50%.
BTC was a bottom-up approach; it’s 14 years old, takes time for it to re-distribute.
Also,… pic.twitter.com/0g97C4ndTN
— James Van Straten (@jimmyvs24) December 4, 2023
The accumulation trend is also visible on Bitcoin’s Hodler Balance Supply Ratio, with 70.6% of the supply being held by long-term asset holders as of December 6th. A similar trend is true of Litecoin, the digital silver-to-bitcoin’s gold, whose Hodler Balance Supply Ratio stands at 60.6% at the time of writing, and climbing at a rapid pace.

In fact, year-to-date, the rate of change for LTC hodlers saw a 12.72% uptick, while that of BTC increased by 6.72%. Being a slightly younger coin which has gone through its third halving cycle this year, Litecoin has historically lagged behind BTC, but is no less secure and adopted than its Bitcoin counterpart.
Did you like the article? Share it!