Bitcoin has settled above the $46,000 mark, with four key data points indicating underlying strength and staying power for the foreseeable future at current levels.
Unmoved Yearly Supply Climbs Higher
As recently indicated by on-chain analyst Will Clemente, Bitcoin’s yearly unmoved supply has reached levels which coincided with prior bull market cycles.
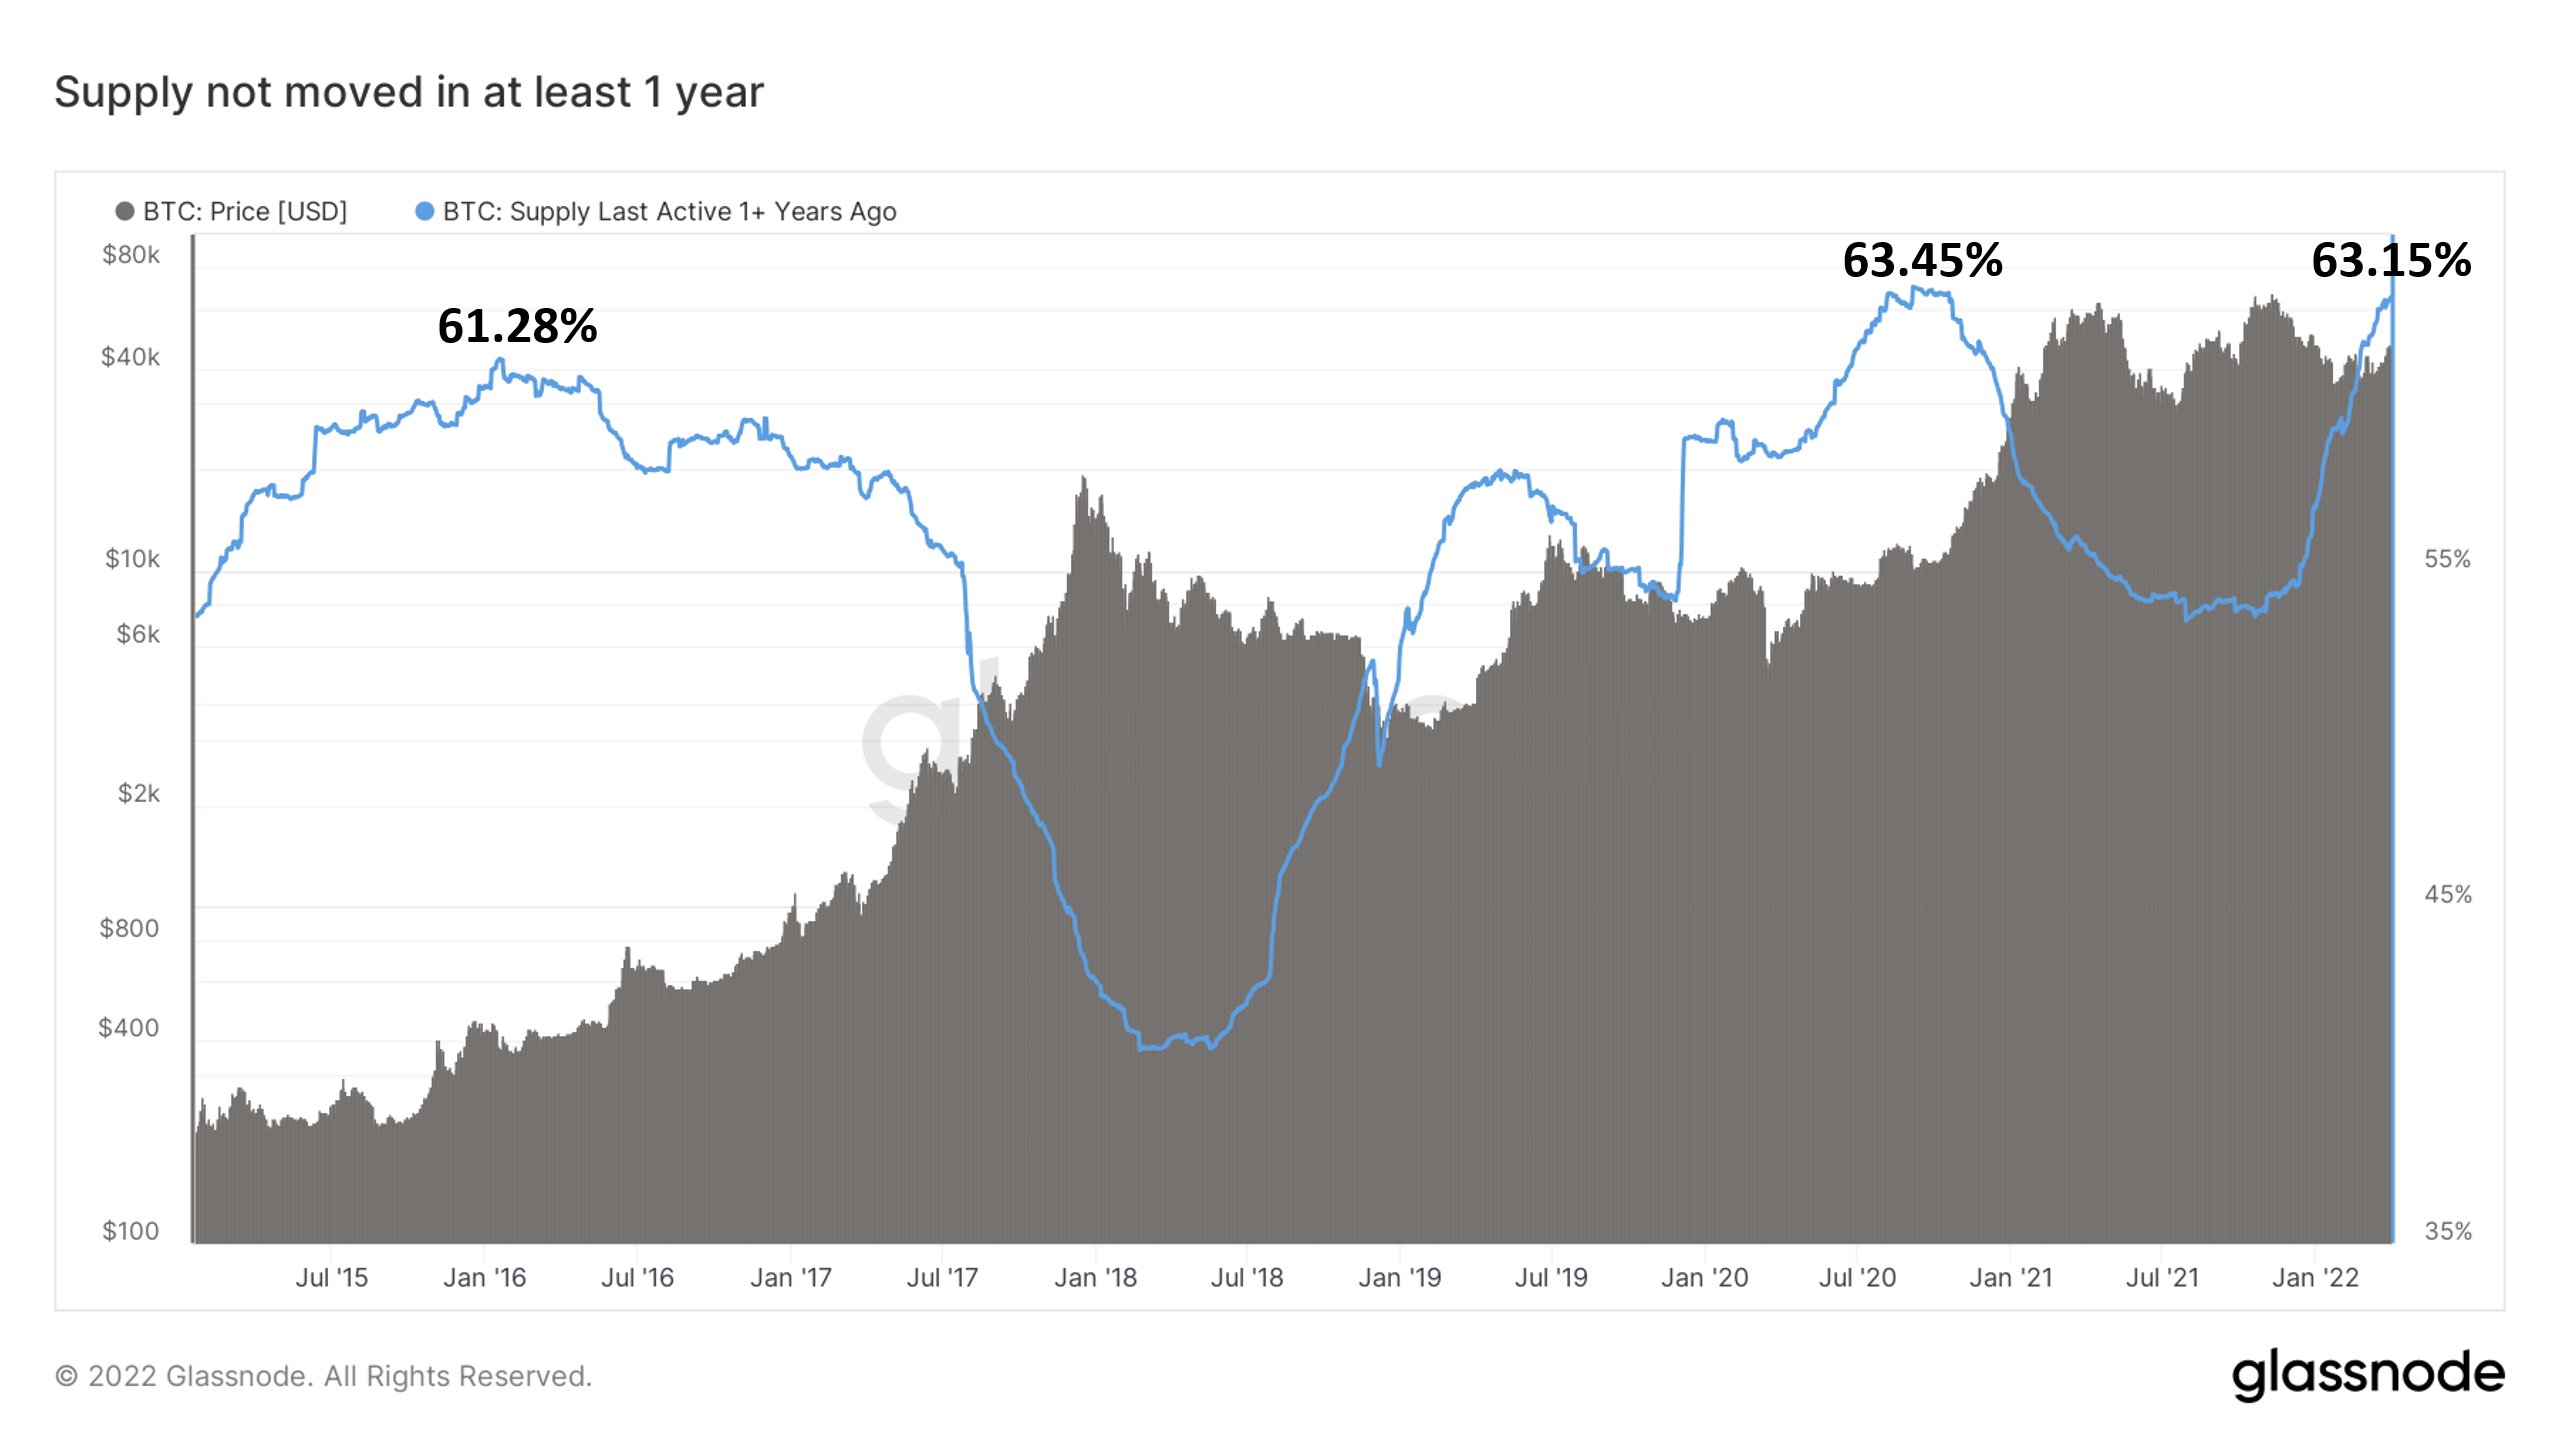
Specifically, “63.15% of Bitcoin’s supply has not moved in at least 1 year. This is just 0.3% shy of an all-time high.”
The trend indicates ‘holding’ behaviour is comparable to prior years when Bitcoin witnessed consistent, step-by-step price-appreciation.
But over the years coins have been lost for various reasons. In fact, it is estimated that around 3-4 million coins are permanently locked and inaccessible. That’s close to 25% of Bitcoin’s total supply.
Cryptocurrencies aren’t going away. Buy Bitcoin & Litecoin here.
Puell Multiple Trend Approaches Breakout
One key metric often touted by both technical and on-chain analysts on either side of the pond is the Puell Multiple.
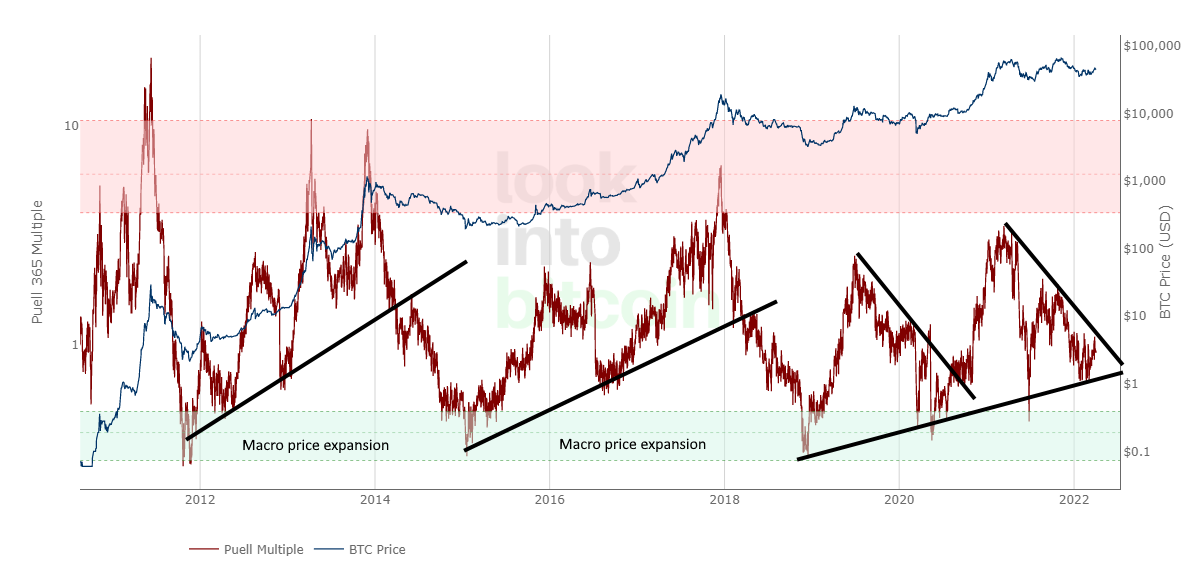
Briefly, the Puell Multiple is defined as the ratio of the daily value of issued coins divided by the 365 day moving average in US Dollars. The equation is interpreted with Bitcoin miners in mind, exploring market cycles from a mining revenue perspective. Miners are sometimes referred to as compulsory sellers due to fixed costs amid extreme volatility. Their revenue therefore influences price over time (though probabilistically less so with each halving).
The above chart indicates macro trends for prior market cycles. In the 2016-2017 bull market, BTC/USD coincided with an uptrend on the Puell Multiple. The same is true for 2012-2014 and today, where the Puell Multiple trends higher at historically significant lows.
Balance on Exchanges Dwindles
Meanwhile, the number of Bitcoins held on exchange has reached a 4-year low, with exchanges holding just over 13% of the total circulating supply on aggregate. This metric coincides with the unmoved yearly supply.
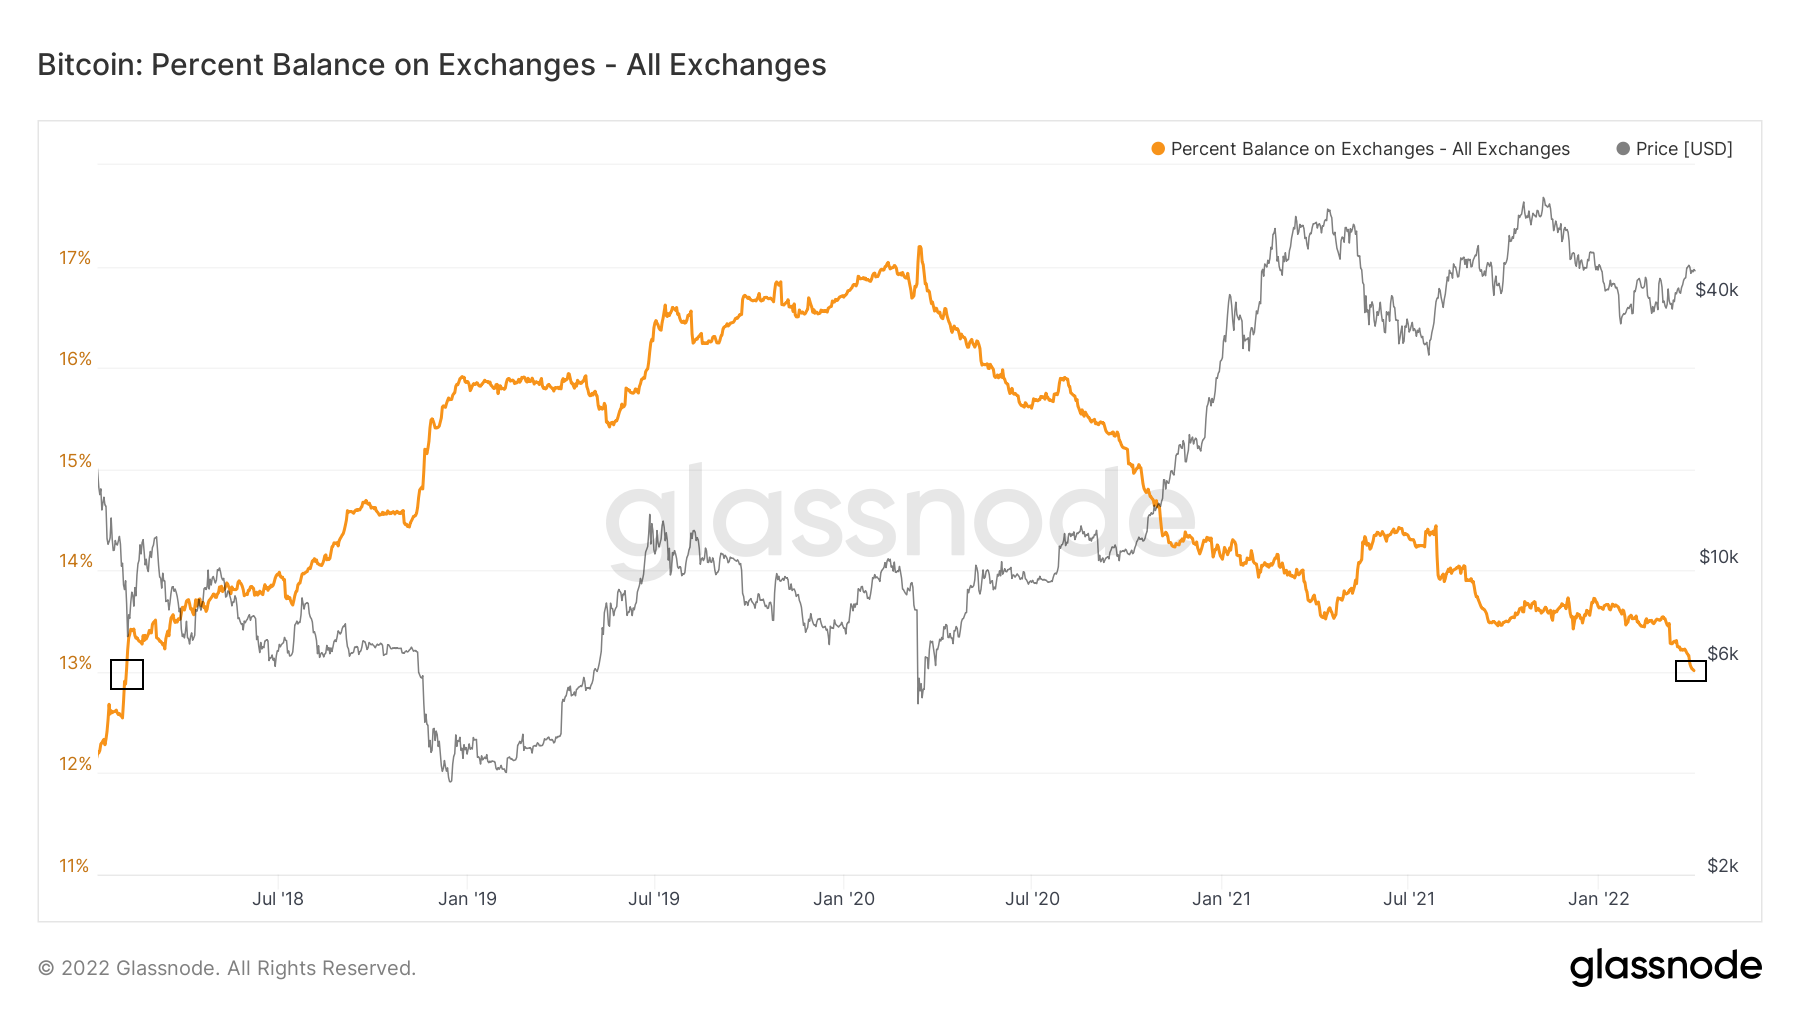
Specifically, there are 2,472,421 million BTC on exchanges at the time of writing. Comparable figures date back to August 2018, when BTC/USD exchanged hands above $6,000.
The trend speaks to a looming ‘illiquid supply shock‘ where there are no longer enough circulating Bitcoin to service demand.
User growth Goes Parabolic
Address creation for Bitcoin has maintained a steady uptrend over the years. Growing address and entity counts are a proxy for new users joining the network, setting up wallets and participating in the Bitcoin economy. This is true of all networked projects, including social media.
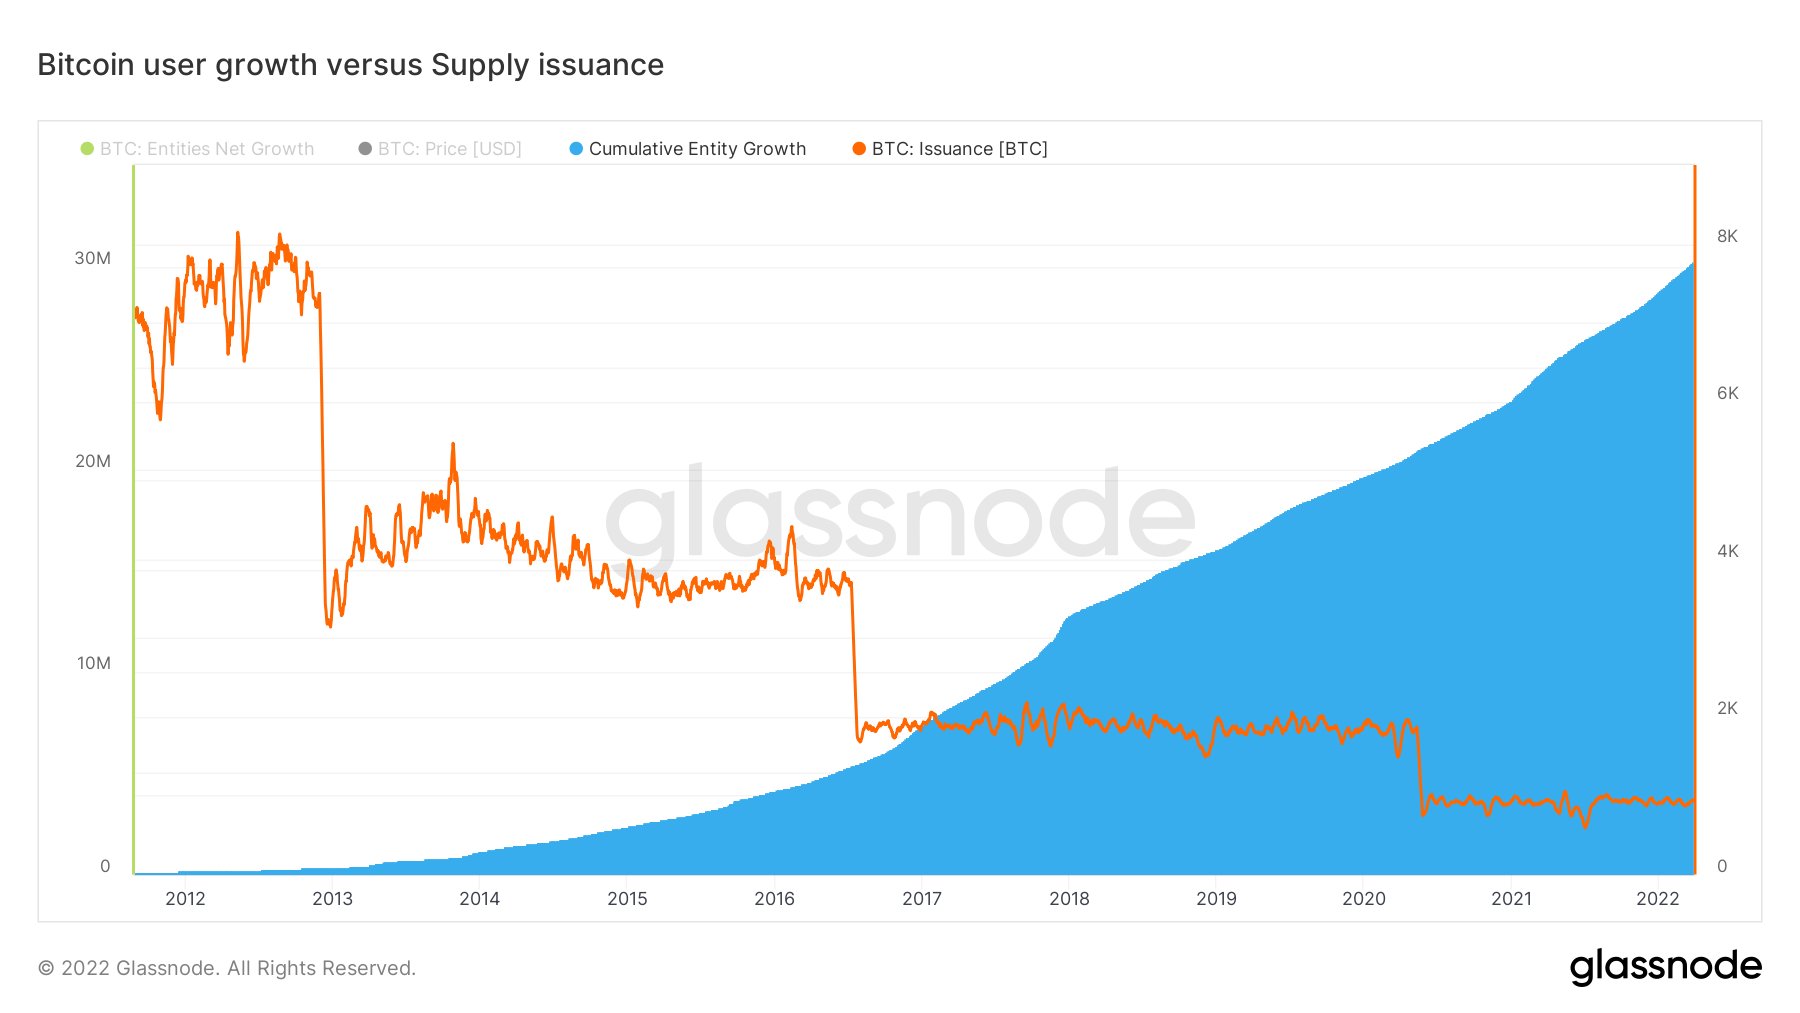
Bitcoin is programmable money, and the long-term game-theoretical model has played out so far per the above chart. As the supply issuance (orange) decreases with each halving cycle, Bitcoin’s user growth (blue) accelerates higher.
In other words, market conviction in Bitcoin has only increased with the passage of time, regardless of draw downs.
Join the telegram channel for updates, charts, ideas and deals.
Did you like the article? Share it!