A fresh Kraken Intelligence report has highlighted several on-chain tailwinds for litecoin that have historically been a harbinger of price discovery for the ‘digital silver’ cryptocurrency.
The report starts out by noting that Litecoin is the most successful Bitcoin fork which has a tendency of taking the spotlight when the market least expects it.
In November 2013, LTC surged from $5 to $63 in a matter of weeks. Four years later, another surge in demand for LTC in December 2017 pushed the cryptoasset from $50 to $369 in a month.
Notably, in both instances the price surges did not happen in a vacuum, but were instead foreshadowed by several on-chain indicators. Per the report, these indicators have fired again.
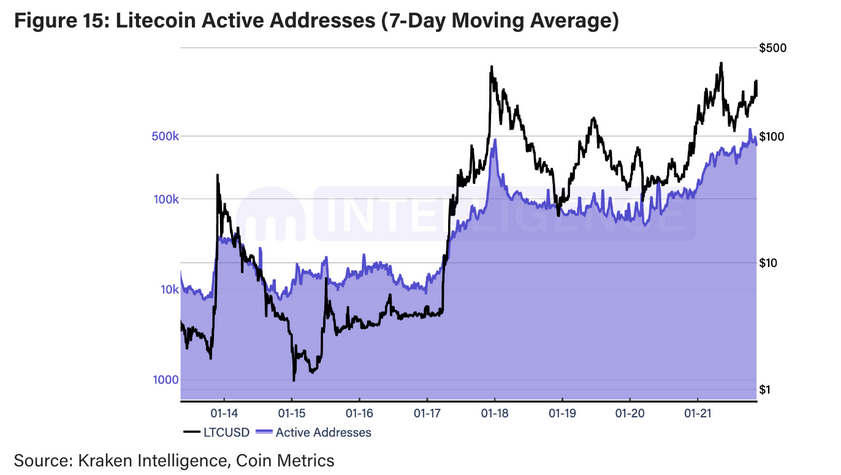
Specifically, the number of unique addresses active in the network shows a parabolic uptrend since December 2020. The authors point out that this network activity has spiked dramatically this year.
The number of active addresses has recently gone vertical, the sharpest increase in activity since April 2021, a sign of a sudden burst in network demand and activity… the 7-day moving average of the number of active addresses recently it an all-time high of 606,730 on October 10th, 2021, or what has historically been a prelude to Litecoin entering into “price discovery” mode.
The authors outline the reasoning for general optimism, citing historical precedent as a robust bulwark for market action.
The 7-day moving average of active addresses hit an all-time high of 16,961 on April 8th, 2013, when LTC was at roughly $4.50. On November 12th, 2013, a new all-time high was set of 18,322. LTC went on to soar from $9.50 to a cycle high of $95 on November 28th 2013.
This sequence of events has happened on multiple occasions.
Similarly, the 7-day moving average of active addresses surpassed a previous all-time high of 41,000 on May 16th, 2017, when it climbed to 41,125. LTC then rose from $23.50 to a cycle high of $369 set on December 17th, 2017.
Notably, addresses with non-zero balances have also been on the rise, which historically eclipses the previous bull market’s all time high before price-action follows. In essence, on-chain data has surged into uncharted territory. This is positively correlated with market action.
Authors also cite Litecoin’s Reserve Risk and MVRV Z-score indicators – tools used to assess macro market bottoms and tops. Reserve Risk assesses long-term HODL confidence relative to the price of the native coin at a given point in time. On the other hand, the MVRV-Z score i sused to assess whether the coin is over/undervalued relative to its ‘fair value’.
Both indicators suggest Litecoin has yet to start its parabolic run.
Join the telegram channel for updates, charts, ideas and deals.
Did you like the article? Share it!