A historically reliable on-chain indicator suggests that bitcoin’s macro rally is far from over contradicting signals on technical charts as bitcoin continues its rapid ascent to fresh 2020 highs.
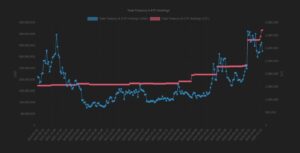
While bitcoin’s “market value to realised value” (MVRV) Z-score is just above the two-year highs at 2.12, per data from Glassnode, the level is still well below the 7.0 point – which typically marks a top in bitcoin’s price.
The MVRV Z-score measures the deviation between market value and realised value, and is used to delineate undervalued and overvalued conditions over a long timeline.
In other words, the cryptocurrency has room to grow even from the low of $3,867 which occurred in mid-March.
The indicator runs in tandem with billionaire hedge fund manager Paul Tudor Jones who recently commented that bitcoin’s rally has only just begun.
 Edit Image
Historically, an MVRV Z-score below zero has coincided with bear market lows, while a reading above 7 has marked bull market tops.
Following the March 12-13 crach, the Z-score fell below zero when prices fell as low as $3,867.
Since then, the cryptocurrency has been in a raging uptrend.
Conflicting signals?
Bitcoin’s 14-week relative strength index (RSI) is an indicator that’s frequently used in technical analysis to gauge price momentum. Per the below chart, it has just cross above 70.00, which means that bitcoin is technically in over-bought territory.
-0001.png/:/rs=w:1280) Edit Image
Edit Image
However, in a strong trending market, the RSI can remain at such high level for extended periods of time, which is to say that bitcoin can remain in ‘overbought’ or ‘oversold’ levels for several weeks.
All in all, this bearish signal does not necessarily imply a major reversal on this macro time-frame. However, it suggests that a period of consolidation or a pullback could be at hand. Naturally, specific price-targets are up for speculation and analyses, which is covered extensively in the semi-weekly newsletter.
From a long-term growth perspective though, these conflicting signals ought to be reconciled to the upside, given that on-chain fundamentals bear more weight in bitcoin’s overall price-trajectory than technical analysis. For institutions, on-chain metrics are the primary motivator and growth driver.
Bitcoin is trading below $13,100 at the time of publishing, having narrowly missed the June 2019 high at $14,000 during Asian trading hours.
Join the telegram channel for updates, charts, ideas and deals.
Did you like the article? Share it!


