Bitcoin lost momentum at around $19,400 as it began to slip further towards breaking its parabolic trend that first began in the first week of October.
While hindsight bias could elaborate on what precipitated the sell off, bitcoin’s technical data has already come back to the mean.
 Edit Image
Bitcoin closed in on the $19,500 price on Wednesday, hitting as high as $19,474 before losing steam. The crypto continued to trend sideways in the following hours, finding brief support at $18,700 before plunging to $16,214 at the time of writing.
Interestingly enough, the unwinding of leveraged trades came before the technical pullback, per data from Glassnode media.
 Edit Image
According to the above chart, futures funding rates saw a multi-month high over the weekend, reaching 0.098%. Every eight hours, a funding fee is paid to lenders from borrowers who leverage trade bitcoin and other cryptocurrencies. Typically, a sharp increase in positive funding rate suggests that the market is at risk of cooling-off due to over-leveraged aggressive traders.
However, given that the funding rate started to cool off well before the drop, it could be that the majority of traders were anticipating a pull-back scenario and acted accordingly. This opens up the possibility that other events might have caused the sell-off. Still the most likely scenario is that a domino effect ensued, with one event compounding sell-side pressure over another.
$800 million longs get liquidated
All in all, long liquidations amounted to a whopping $800 million, matching the amount of liquidations since the black Thursday sell off in March when bitcoin fell to $4,000. This was further exacerbated by the fact that no technical structure was built during the parabolic run-up, opening the door to a cascading effect of stop-loss triggers and forced liquidations.
.png/:/cr=t:0%25,l:0%25,w:100%25,h:100%25/rs=w:1280) Edit Image
Edit Image
Bitcoin parabola falls short of $20,000
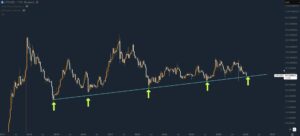
Bitcoin had been in a steady parabola without retracing for weeks on end, per the below 3-day chart. From a technical perspective, such an incredible run-up beggars belief, as this kind of price-action hasn’t been recorded since 2013 when bitcoin parabolas preceded thousand-percent increases in the following months.
While this pull-back scenario had been touted by various influential personas on Twitter, many traders on Crypto Twitter were anticipating that the $20,000 psychological level would be taken out before a correction.
However, CNBC’s Brian Kelly was not among this crowd. Indeed, CNBC finally managed to correctly forecast a local top, citing the fact that 2017 buyers would be looking to sell their holdings close to all time highs if the opportunity presented itself.
.png/:/rs=w:1280) Edit Image
Edit Image
Of course, any number of reasons could be argued for now that the sell-off took place.
However, despite this turnaround, there’s reason to be optimistic. Indeed, while this sell-off has been bloody and may continue for a while longer, the path of least resistance for bitcoin remains to the upside.
After all, macro bullish factors aren’t going away over night. On the contrary, they’re only expected to increase.
Bitcoin’s long-term prospects exist in contrast to short term liquidity grabs, which are inadvertently reconciled in the direction that provides the most of it.
Subscribe to the semi-weekly newsletter for regular insight into bitcoin and crypto. Go on. It’s free.
Join the telegram channel for updates, charts, ideas and deals.
Did you like the article? Share it!