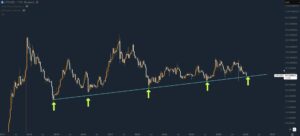
A glance at on-chain indicators, specifically bitcoin’s adjusted Spent Output Profit Ratio (aSOPR), suggests that the bulk of this correction has come to an end.
In fact, the long-term aSOPR suggests that the trend is still in tact.
aSOPR explained
The on-chain metric is used to measure profit and loss in the overall market for every bitcoin transaction. The figures are compiled by measuring the variation between the sale and purchase price for coins.
Want to acquire Bitcoin, Ethereum and other crypto? Start here.
When aSOPR is higher than 1, it means that the average buyer is selling at a profit. Conversely, when it’s below 1 then sellers are exchanging coins at a relative loss.
It is calculated by taking the ratio of the value for each UTXO when it’s spent and when it was created.
In a bull market, the aSOPR typically resets at 1 and bounces from this level. This is because it’s rare for coins to exchange hands at a loss for a prolonged period of time when prices are rising. The opposite is true for bear markets.
The Adjusted SOPR (aSOPR) filters the noise from the signal by discounting UTXOs with a lifespan of less than one hour.
Coins exchange hands at a historically significant level
A look at the aSOPR suggests that the bull market began in September 2020, before which the metric freely traversed above and below zero. This indicated an unclear direction in the trend.

Since then, the metric has consistently stayed above 1, resetting on several notable occasions along the way. In January, February and April (today), the aSOPR reset, marking a local bottom in bitcoin prices.
It is currently at 1.0, indicating that market conditions remain bullishly biased.
Subscribe to the semi-weekly newsletter for regular insight into bitcoin and crypto. Go on. It’s free.
Join the telegram channel for updates, charts, ideas and deals.
Did you like the article? Share it!


